Changelog
Dec 15, 2025
30 High-Fidelity Gemini Infographic Prompts That Finally Get Text Right
Gemini has finally cracked the code for rendering text inside images for infographics with Nano Banana Pro. I spent last week testing it to create usable, editable infographics. Below you’ll find 30 high-fidelity prompts, categorized by style (Corporate, Editorial, Educational, Creative, Bonus Fun) that you can copy-paste to instantly generate beautiful visual assets.
We all know the struggle: you have great data, but designing the visual takes hours. Or you try using Midjourney, but the text is unreadable.
Enter the brand-new Gemini 3 model (Nano Banana Pro). Its text-rendering capabilities are a massive leap forward. You can create these infographics directly in gemini.google.com using the prompts below!
We’ve curated and refined 30 specific infographic prompts. These aren’t just prompts to create a chart—they include style modifiers, layout logic, and design terminology to push the model toward impressive results.
Pro tip: Unsure which style to use? If you’re not sure which infographic style best fits your data, simply give your data to Gemini and ask it to create the most effective infographic style for that information. It does a surprisingly good job rolling the dice and choosing the right format for you.
Example
How to use them
Copy the code block.
Replace [BRACKETED TEXT] with your specific topic.
Nano Banana Pro is grounded in Google Search data, so you can try staying high-level with your topic and text to see how it visualizes the subject. If the result isn’t good enough, you can add as much detail and guidance as you want to the infographic content.
Cluster 1: The Corporate & Data Suite
Ideal for: Presentations, quarterly reports, and LinkedIn thought leadership.
1. The Minimalist Data Story
Style: Clean, lots of white space, Swiss design influence.
Prompt:
Create a high-resolution vertical infographic for [MAIN TOPIC]. Style: Clean minimalist. Layout: 4–6 distinct data sections with clear hierarchy. Visuals: Simple sans-serif typography (Helvetica-style), light neutral background, monochrome icons. No clutter, no gradients. Emphasize negative space and alignment. Render text labels clearly.
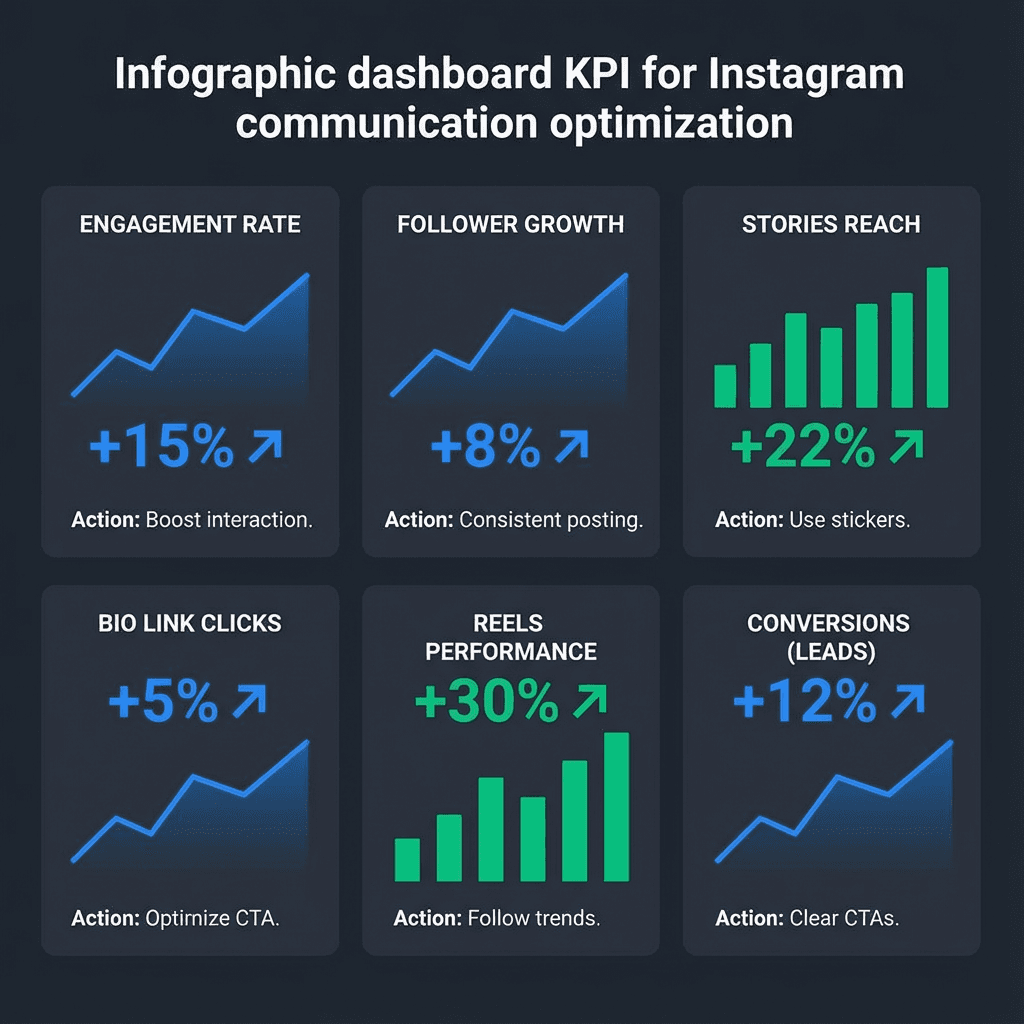
2. The Corporate Dashboard
Style: SaaS dashboard, dark UI, high contrast.
Prompt:
Design a corporate-style KPI dashboard infographic for [METRICS TOPIC]. Layout: Grid-based dashboard with 6 key metric cards. Visuals: Flat design, simple bar charts and line graphs. Palette: Dark slate background with electric blue and emerald green accents. Typography: Roboto or Inter style, clean and readable. Include percentage callouts.
3. The Timeline Roadmap
Style: Linear, progressive, milestone-based.
Prompt:
Generate a horizontal roadmap infographic for [TIMELINE TOPIC]. Layout: Left-to-right linear progression line with 6 milestone nodes. Visuals: Isometric vector style, clean connectors. Each milestone features a unique icon and a year label. Palette: Professional gradient (Blue to Purple). High-definition vector art style.
4. The Two-Column Comparison
Style: Side-by-side battle, pros/cons.
Prompt:
Create a split-screen comparison infographic: [OPTION A] vs [OPTION B]. Layout: Symmetrical two-column grid. Visuals: Left side uses [COLOR A], right side uses [COLOR B]. Central axis shows comparison icons (checkmarks vs Xs). Style: Modern flat vector. Text alignment: Centered and strictly organized.
5. The Data Comparison Bar
Style: Statistical, numerical, precise.
Prompt:
Design a professional bar chart infographic highlighting [DATA COMPARISON TOPIC]. Layout: Horizontal bars sorted in descending order. Visuals: Matte-finish 3D bars, soft shadows, clear axis lines. Annotations: Floating text bubbles explaining key insights. Palette: White background, energetic accent colors for key data points.
Cluster 2: The Editorial & Magazine Suite
Ideal for: Medium articles, newsletters, and viral social posts.
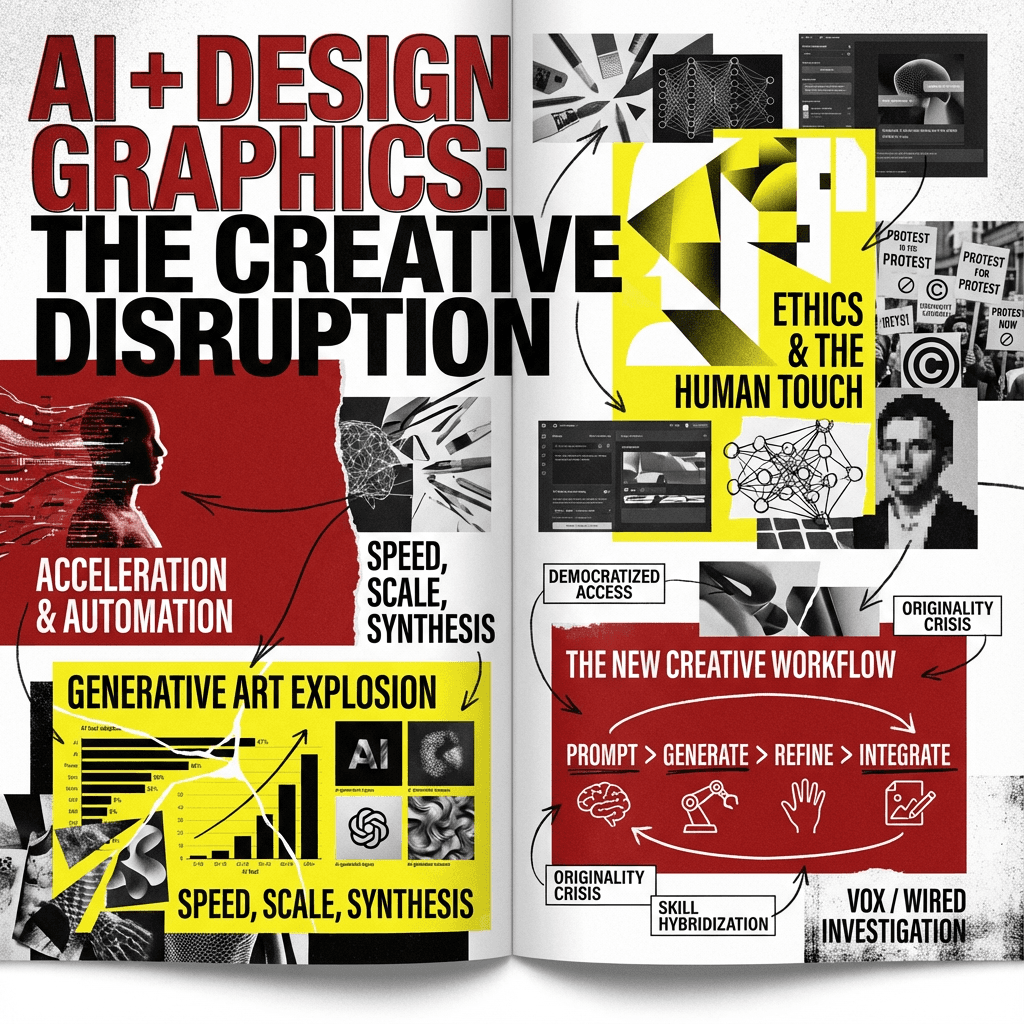
6. The Bold Editorial
Style: Wired Magazine, Vox, high-impact journalism.
Prompt:
Design a bold editorial infographic about [MAIN TOPIC]. Style: Magazine double-page spread aesthetic. Visuals: Asymmetrical grid, massive headline typography, high-contrast color blocks (Yellow/Black or Red/White). Incorporate collage-style elements and abstract shapes. Add subtle grain texture overlay.
7. The Dark-Mode Tech
Style: Cyberpunk, crypto, developer-focused.
Prompt:
Create a sleek dark-mode infographic explaining [TECH TOPIC]. Style: Futuristic UI. Background: Deep black/charcoal. Accents: Neon cyan and magenta. Visuals: Thin glowing lines, glassmorphism card effects, monospaced coding fonts. Schematic technical-drawing aesthetic.
8. The Gradient Hero Funnel
Style: Marketing, conversion, flow.
Prompt:
Generate a vertical funnel infographic for [FUNNEL TOPIC]. Visuals: A large-to-narrow 3D funnel shape floating in the center. Coloring: Smooth modern mesh gradients (Instagram-style brand colors). Layers: 5 distinct sections with side labels. High-gloss 3D rendering style.
9. The Quick Facts Icon Grid
Style: Instagram carousel, snackable tips.
Prompt:
Create a 3×4 grid infographic for [FACTS TOPIC]. Layout: Mosaic bento-box style. Content: Each tile contains a large flat-design icon and a short bold caption. Palette: Pastel backgrounds, dark gray icons. Style: Corporate Memphis / Big Tech art style. Highly shareable.
10. The Hierarchy Pyramid
Style: Maslow’s hierarchy, mastery levels.
Prompt:
Design a 5-layer pyramid infographic for [PYRAMID TOPIC]. Visuals: Stylized geometric pyramid. Coloring: Gradient from dark at the base to light at the top. Labels: Floating text on left and right connected by thin guide lines. Background: Subtle geometric pattern.
Cluster 3: The Educational & Explainer Suite
Ideal for: How-to guides, course materials, and student resources.
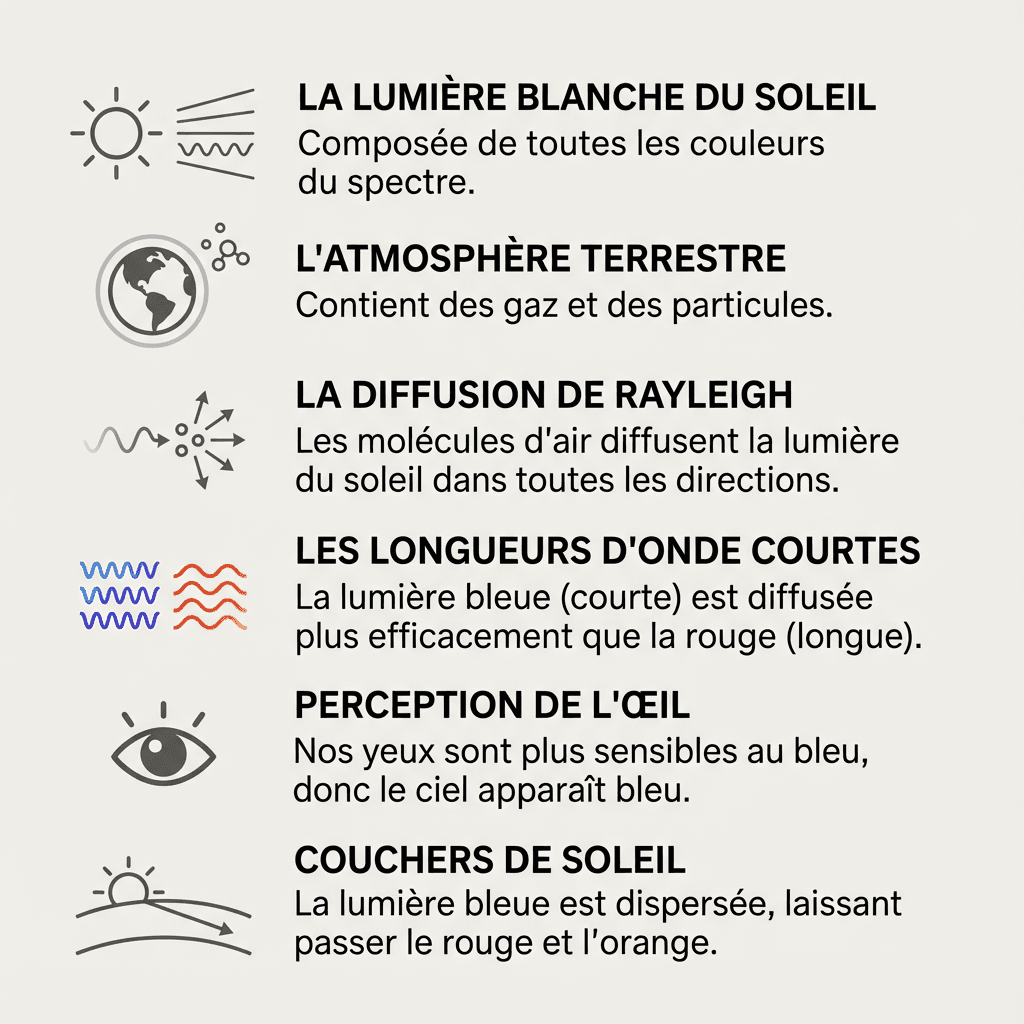
11. The Soft Educational Pastel
Style: Friendly, approachable, kindergarten-teacher vibe.
Prompt:
Create a soft educational infographic explaining [EDUCATIONAL TOPIC]. Style: Hand-drawn but polished vector feel. Palette: Soft pastels (Mint, Peach, Lavender). Visuals: Rounded shapes, friendly characters, bubble lettering for headings. Layout: Vertical flow with numbered steps. Accessible and kind aesthetic.
12. The Flat Illustration Process
Style: Step-by-step, instruction manual (IKEA-style).
Prompt:
Generate a process infographic for [PROCESS TOPIC]. Style: Flat vector illustration 2.0. Layout: S-shaped path winding down the page. Visuals: 5 distinct steps shown with character illustrations interacting with objects. Connectors: Dotted lines. Colors: Bright primary colors on white background.
13. The Step-by-Step Checklist
Style: Actionable, clipboard, productivity.
Prompt:
Design a vertical checklist infographic for [CHECKLIST TOPIC]. Visuals: Clipboard or stylized paper background. Content: 10 items with empty checkboxes on the left. Typography: Handwritten marker style for the title, clean sans-serif for the list. Clear separation between items.
14. The Circular Framework Diagram
Style: Systems thinking, holistic cycles.
Prompt:
Create a circular cycle infographic for [FRAMEWORK TOPIC]. Layout: Central concept surrounded by 6 radial segments. Visuals: Ring-chart aesthetic, flat colors. Arrows indicating clockwise motion. Icons inside each segment. Clean, mathematical precision.
15. The Long Explainer Panel
Style: Tall Pinterest pin, deep dive.
Prompt:
Generate a long infographic panel for [EXPLAINER TOPIC]. Structure: Divided into 5 horizontal color bands. Content: Each band features a headline, a short paragraph, and a supporting isometric illustration. Style: Editorial illustration, muted earthy tones.
Cluster 4: The Creative & Conceptual Suite
Ideal for: Brainstorming, creative blocks, and artistic visualization.
16. The Hand-Drawn Sketchnote
Style: Notebook, napkin math, brainstorming.
Prompt:
Design a sketchnote-style infographic for [SKETCHNOTE TOPIC]. Background: Crumpled graph-paper texture. Visuals: Thick marker doodle lines, hand-drawn arrows, circled text, highlighted emphasis. Font: Realistic handwritten style. Casual, creative vibe.
17. The Concept Mind Map
Style: Neural network, brainstorming web.
Prompt:
Create a complex mind-map infographic for [CONCEPT TOPIC]. Layout: Central node with organic branches extending outward. Visuals: Nodes are colored bubbles connected by curved Bézier lines. Style: Organic, biological UI aesthetic. White background with clearly colored branches.
18. The Storyboard Journey
Style: User experience, comic strip, narrative.
Prompt:
Generate a storyboard infographic visualizing [JOURNEY TOPIC]. Layout: 2 rows of 3 cinematic panels (comic-strip style). Visuals: Consistent character moving through a scenario. Text: Captions beneath each image. Style: Semi-realistic vector art.
19. The Process Flowchart
Style: Engineering, logical flow, algorithm.
Prompt:
Design a technical flowchart infographic for [WORKFLOW TOPIC]. Visuals: Geometric shapes (diamonds for decisions, rectangles for actions). Connectors: Right-angle arrows. Style: Blueprint aesthetic, blue background with white lines. High technical precision.
20. The Multi-Layer Venn
Style: Overlapping concepts, finding the sweet spot.
Prompt:
Create a 3-circle Venn diagram infographic for [VENN TOPIC]. Visuals: Large overlapping circles with transparency effects (multiply mode). Colors: Cyan, Magenta, Yellow (CMY) blending into secondary colors. Labels: Clearly placed in central overlaps. Minimalist design.
Cluster 5: The Creative Bonus Suite
Ideal for: Viral hooks, fun concepts, and standing out.
21. The Cinematic Movie Poster
Style: Hollywood blockbuster, dramatic lighting.
Prompt:
Design a conceptual movie-poster infographic for [TOPIC]. Style: Cinematic realism, dramatic teal-and-orange lighting. Layout: Central hero character or object with credits-style text at the bottom for data points. Title: Massive metallic 3D typography. Texture: Film grain, lens flare.
22. The Whiteboard Strategy Session
Style: Startup war room, dry-erase markers.
Prompt:
Create a realistic whiteboard infographic for [TOPIC]. Visuals: Photorealistic whiteboard surface with reflections. Content: Drawn using red, blue, and black dry-erase markers. Handwriting: Messy but legible cursive and block letters. Diagrams: Circles, arrows, underlined key terms. Lighting: Overhead office fluorescent.
23. The Retro 8-Bit Game
Style: Pixel art, NES era, nostalgia.
Prompt:
Generate a pixel-art infographic for [TOPIC]. Style: 8-bit video-game aesthetic. Layout: Game UI screen. Data points: Represented as health bars, coin counters, or inventory slots. Background: Starfield or dungeon brick pattern. Font: Arcade pixel font. Palette: Limited vibrant palette.
24. The Vintage Travel Poster
Style: Art Deco, national parks, WPA style.
Prompt:
Design a vintage travel-poster infographic for [TOPIC]. Style: WPA national park poster aesthetic. Visuals: Screen-print texture, large flat colors, bold geometric mountains or landscapes. Typography: Large condensed Art Deco lettering. Palette: Earthy oranges, forest greens, and cream.
25. The Lego Brick Builder
Style: Plastic bricks, toy photography, playful.
Prompt:
Create a brick-built infographic for [TOPIC]. Visuals: All elements constructed from plastic toy bricks. Charts: Bar charts made of stacked bricks. Background: Plastic baseplate. Lighting: Macro toy-photography style with depth of field. Text: Raised lettering on smooth tiles.
26. The Comic-Book Hero
Style: Vintage Marvel/DC, halftone dots, dynamic action.
Prompt:
Design a comic-book page infographic for [TOPIC]. Layout: Dynamic panels with jagged borders. Visuals: Superhero character demonstrating the concept. Text: Speech bubbles and yellow narration boxes. Style: Halftone shading, bold black outlines, vibrant primary CMYK colors.
27. The Minion Chaos
Style: Animated movie, yellow helpers, chaotic fun.
Prompt:
Create a fun animated-movie-style infographic for [TOPIC]. Visuals: Small yellow capsule-shaped characters with goggles and denim overalls helping with the data. Mood: Playful and energetic. Layout: Characters holding or building the charts. Background: Industrial lab or bright blue sky. Colors: Banana yellow and denim blue.
28. The Claymation Studio
Style: Modeling clay, stop-motion, handmade texture.
Prompt:
Design a claymation-style infographic for [TOPIC]. Visuals: All elements look like hand-sculpted modeling clay with visible fingerprints. Lighting: Soft studio lighting with realistic shadows. Text: Formed from rolled clay snakes. Background: Cardboard set design. Mood: Whimsical and tactile.
29. The Neon Nightlife
Style: Cyberpunk, Las Vegas, glowing tubes.
Prompt:
Generate a neon infographic for [TOPIC]. Background: Dark brick-wall texture. Visuals: Data points represented as glowing glass neon tubes. Colors: Electric pink, cyan, and lime green. Text: Cursive neon typography connected by wires. Mood: Smoky, dark, high contrast.
30. The Graffiti Wall
Style: Street art, spray paint, urban.
Prompt:
Create a street-art graffiti infographic for [TOPIC]. Background: Urban concrete wall texture. Visuals: Stencils and spray-paint murals representing the data. Charts: Dripping paint-style bars. Text: Bubble letters or tag-style typography. Palette: Vibrant aerosol colors on gray concrete.
Golden Rules for Gemini Infographics
Aspect ratio matters: By default, Gemini generates squares. For infographics, almost always add
--ar 9:16(mobile/Pinterest) or--ar 16:9(presentations) to your prompt if the platform allows it, or clearly specify a vertical layout in the text prompt.The 400-word limit for text clarity: To ensure near-perfect text rendering (99%+ accuracy in my tests), try to keep the total amount of text in your image prompt under 400 words. Going beyond that can sometimes cause hallucinations or blurry text.
Spell-check: Gemini 3 is excellent at spelling, but not perfect. If there’s a typo in a title, don’t throw the image away. Use the internal edit/modify tool, highlight the text area, and type:
Correct text to read: [Correct spelling]Watermarks & subscriptions: If you’re a Gemini Ultra subscriber, you can generate infographics without the Gemini watermark in the corner, directly in Gemini Canvas.
Level up with AI Studio: For best results, use Google AI Studio instead of the standard Gemini interface. It costs about $0.06 per image via the API key, but you get higher overall quality, can force 2K or 4K resolution, use Google Search grounding for factual accuracy, and completely remove the Gemini watermark.
Changelog